
Single Source of Truth (SSoT)
In the Summer of 2021, I had the opportunity to intern with the Vehicle Quality Engineering (VQE) group at Nissan's vehicle assembly plant in Canton, Mississippi. Specifically, I worked with VQE's data analytics team, consisting of a data engineer and a co-op computer science student from Jackson State University.
Nissan North America's VP of Manufacturing tasked us with undertaking a project called Single Source of Truth (SSoT) at the Canton plant. The various data management practices across the many departments at the plant — including Trim and Chassis, Paint, Body Shop, and VQE, among others — were unstandardized and disjointed, operating independently without any sort of overarching guidance or intercommunication. Processes of data collection and storage could vary from group to group, and there were too many obstacles keeping managers from accessing data from outside their group.
Our job was to standardize processes of data collection, centralize data storage, and ease accessibility to data across the plant. In essence, our task was to help these different groups "talk" to each other better, streamlining interdepartmental decision-making, driving efficiency, bringing data management practices up to date, and fundamentally altering the paradigm of plant operations.
In our meetings with the VP of Manufacturing, he would repeatedly reference the chart of a biological ecosystem (like the ones you'd see in a high school science textbook) to illustrate the idea behind SSoT. Our goal was to move away from the idea of a hive mind — with disparate processes functioning independently toward a common goal — and toward the model of a complex ecosystem, with interdependent processes exchanging information freely and automatically, maintaining a natural balance that allows all stakeholders to succeed.

My Role
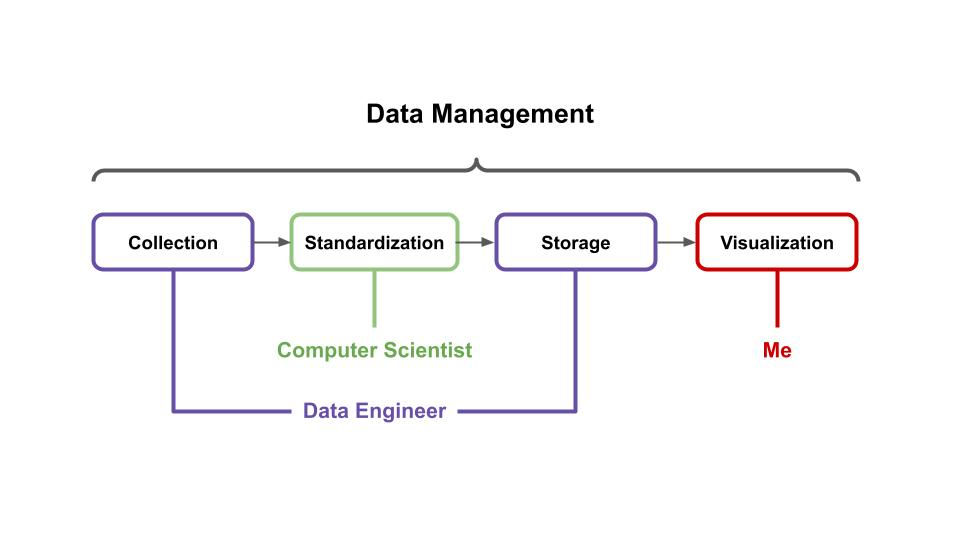
Our three-person team delegated responsibilities according to our strengths.
The data engineer, the only full-time Nissan employee on our team, worked with other divisions in the plant to better understand their data collection processes and introduce new technology to improve parts tracking and process uniformity. I had the opportunity to sit in with him on a meeting with a third-party inventory management company that uses blockchain technology to facilitate parts tracking and quality assurance. He also worked with database specialists to transition data storage to a data lake.
The computer science co-op student wrote VBA scripts to automatically pull data from each division's unique input sheets and standardize it into a number of "master sheets" compatible with Tableau, the visualization software we chose to use.
Finally, I worked with managers across different divisions — including Trim-and-Chassis and Vehicle Quality Audit (VQA), for example — to understand which datasets were most informative for decision-making and reporting, and to outline what their various use cases might be. I then constructed a number of Tableau dashboards for each division, iteratively working off of feedback from each manager. Once finished, I would then publish the dashboard on the plant's Tableau server, where it would be accessible to anyone at the plant who needed it.
For Trim-and-Chassis fit-and-finish (the group responsible for ensuring the gaps and flush between different exterior parts of the vehicle are within specification), for example, I constructed a dashboard depicting a four-sided vehicle diagram (driver-side, passenger-side, front, and rear), with each of over 50 critical points on the exterior of the vehicle labeled with the most recent measurement taken for a specified vehicle ID number. Each measurement was color-coded to indicate whether it was within the spec limits, and selecting an individual critical point would navigate the user to a scatter plot of all the measurements taken for that point over a specified period of time. I did this for three different models (Altima, Frontier, and Titan). In practice, this dashboard, which is still in use, assists with root-cause analysis, allowing the user to see exactly which critical points are consistently out of spec so they know who in the plant to notify to correct the problem.
Takeaways
I'm grateful for the exposure Nissan gave me to high-level management and decision-makers at the Canton plant and across the organization as a whole. My team had repeated check-ins with Nissan North America's VP of Manufacturing, who took particular interest in our project. At the conclusion of my internship, I had the opportunity to present my work to a room full of plant managers, senior managers, directors, and even the director of the entire Canton plant.
Overall, the Nissan data analytics internship gave me valuable insight into the data management pipeline at a major multinational corporation. I quickly had to become comfortable arranging and conducting meetings with people in positions far superior to mine. I further refined my technical communication skills, as I often had to present the "elevator pitch" for the SSoT project and my role within it to those who were not familiar with the technology we were implementing. Lastly, I vastly improved my comfort with Tableau and my data visualization skills.
Outside of work, I made lasting friendships and professional connections (I still keep in touch with many of my fellow interns, as well as the other two members of my team), and got acquainted with the charming Fondren district of Jackson, Mississippi, where I was based.

At the conclusion of my internship, I had the opportunity to present my work to a room full of plant managers, senior managers, directors, and even the director of the entire Canton plant.
